If you've been researching the Culver City real estate market online, you've already noticed something confusing.
Zillow shows one number. Redfin shows another. Movoto shows something completely different. And none of them match what you're actually seeing when you look at active listings and recent sales.
Here's why and here's what the market is actually doing.
Zillow currently shows an average Culver City home value of $1,272,174. Movoto reports a median of $990,000 with homes sitting an average of 55 days on market.
The live TheMLS data for single-family homes in Culver City pulled directly on May 26, 2026 tells a completely different story:
Average sold price: $1,900,211. Median sold price: $1,688,500. Median days on market: 15 days. Sold vs. list price: 104.03%.
That is not a modest discrepancy. Zillow is showing $628,037 below the actual average sold price for single-family homes in this market right now. Movoto's median is $698,500 below the actual median.
These gaps don't mean the platforms are broken. They mean they're measuring something different all property types combined, extended time windows, broader geographic definitions producing numbers that are essentially useless for anyone trying to price a listing, make a competitive offer, or understand what is actually happening in the Culver City single-family home market today.
I'm Danielle Edney a third-generation Angeleno and Los Angeles real estate specialist serving Culver City, Baldwin Hills, Baldwin Vista, Ladera Heights, View Park-Windsor Hills, Playa Vista, Santa Monica, Venice, and Mar Vista. I pull my own MLS data every month because the only way to give buyers and sellers genuinely useful guidance is to know exactly what the market is doing not what an algorithm says it was doing six months ago across a mixed dataset.
Here is the complete, accurate Spring 2026 Culver City housing market update.
The Complete Spring 2026 Data Culver City Single-Family Homes
Data Parameters: Single-family homes | City of Culver City | Active and Sold: March 26 - May 26, 2026 Source: TheMLS™ May 26, 2026 | Danielle Edney, DRE #01826849
Active Listings 27 Homes Currently on the Market
-
Number of active listings: 27 homes
-
Median list price: $1,699,000
-
Average list price: $2,009,292
-
High list price: $5,500,000
-
Low list price: $829,900
-
Average price per sq. ft.: $1,012.32
-
Median price per sq. ft.: $993
-
Average home size: 1,981 sq ft
-
Average lot size: 5,446 sq ft
-
Average days on market (active): 44 days
-
Median days on market (active): 33 days
-
Total active inventory value: $54,250,898
Recently Sold 36 Homes Closed in 60 Days
-
Number of homes sold: 36
-
Median sold price: $1,688,500
-
Average sold price: $1,900,211
-
High sold price: $4,300,000
-
Low sold price: $950,000
-
Average price per sq. ft.: $1,089.05
-
Median price per sq. ft.: $1,108
-
Average home size: 1,848 sq ft
-
Average lot size: 5,961 sq ft
-
Sold vs. list price: 104.03%
-
Sold vs. original list price: 103.08%
-
Total sales volume: $68,407,615
-
Median days on market (sold): 15 days
-
Average days on market (sold): 25 days
Days on Market Breakdown The Data That Tells the Real Story
|
Days on Market |
Homes Sold |
% of Total |
Avg. Sold vs. List |
|
0–30 days |
28 |
77.78% |
106.26% |
|
31–60 days |
4 |
11.11% |
96.56% |
|
61–90 days |
3 |
8.33% |
100.25% |
|
91–120 days |
0 |
0.00% |
— |
|
120+ days |
1 |
2.78% |
98.16% |
Source: TheMLS™ — May 26, 2026 | Danielle Edney, DRE #01826849
The Five Insights Every Culver City Buyer and Seller Needs Right Now
Insight 1: 104.03% Sold-to-List Is Not a Typo And Here's What It Means
The headline number in this dataset 104.03% average sold vs. list price is the most important data point for every seller currently thinking about listing in Culver City.
It means the average home that sold in Culver City between March and May 2026 closed at 4.03% above its list price. Not at list. Not close to list. Above it.
And the 30-day sellers averaged 106.26% of list price meaning buyers in that competitive window were routinely paying 6+ percent above asking to win the home they wanted.
On a $1,699,000 median list price:
-
Sale at 106.26% of list: $1,805,358
-
Sale at list price: $1,699,000
-
Premium captured: $106,358
That premium is not generated by luck or timing. It is generated by preparation, strategic pricing, and a marketing launch that creates genuine buyer competition in the first 30 days. Sellers who execute correctly in this market are not just getting their asking price they are being bid above it by motivated buyers competing against each other.
This is what a true seller's market looks like. And the data confirms it unambiguously.
Insight 2: The Platform Gap Why Everything You've Read About This Market Is Wrong
The contrast between what major platforms report and what your live TheMLS data shows is the most important educational story in this blog and it is directly relevant to every buyer and seller who has been using online tools to understand this market.
|
Source |
Median/Avg Price |
Days on Market |
Data Type |
|
Zillow |
$1,272,174 avg |
~12 days |
All property types, ZHVI index |
|
Redfin |
$1,600,000 median |
49 days |
All property types, Nov 2025 |
|
Movoto |
$990,000 median |
55 days |
All property types, older window |
|
TheMLS (Live) |
$1,688,500 median |
15 days |
SFR only, current 60-day window |
The reasons for these gaps are consistent with what we've seen in Baldwin Hills:
Property type mixing is the primary driver. When condos, townhomes, and multi-family units are averaged with single-family homes, the median price drops dramatically. Culver City has a significant condo and townhome market particularly in Fox Hills that pulls the blended median far below the single-family reality.
Time window differences produce stale data in a fast-moving market. Platforms averaging 12 months of transactions include sales from periods when the market was behaving differently. A 60-day window reflects what is happening right now.
The sold vs. list ratio story never appears on platforms. No major consumer platform surfaces the 104.03% sold-to-list ratio that is the most important pricing signal in this market. Sellers who price from Zestimates may underprice significantly. Buyers who offer at list price will consistently lose.
This is precisely why pulling from TheMLS directly filtered to single-family homes, in the current window produces the only data that is actually actionable for pricing and offer decisions in this market today.
Insight 3: The $106,358 Premium on 30-Day Sales Understanding What Creates It
The 28 homes that sold within 30 days 77.78% of the total averaged 106.26% of list price. That premium does not appear randomly. It is consistently produced by the same set of conditions:
Strategic pricing from current sold comparables. Homes priced from actual transaction data not from Zestimates, not from what the seller hopes to achieve enter the market as the obvious best value at their price point. That positioning creates buyer urgency.
Professional presentation that commands attention. Realtors know how to effectively use professional photography, targeted marketing, and expert negotiation to get sellers the best sale. In a market where buyers are paying 106% of list price, the homes generating that outcome are the ones that photograph exceptionally, tour immersively, and market comprehensively from day one.
A Coming Soon pre-launch that loads the opening window. The first 30 days are everything in this market. A Coming Soon campaign activating buyer interest before the listing goes live means the peak interest window begins with motivated, qualified buyers already lined up to schedule showings.
Multiple offers, handled strategically. The 106.26% average is the result of buyers competing against each other not one buyer paying above asking out of desperation. An offer deadline, properly managed, brings multiple buyers to the table simultaneously. That competition is what drives the final price above list.
The sellers who achieve 106% of list price are not luckier than the sellers who achieve 96% of list price. They are more prepared.
Insight 4: $1,089/Sq Ft What Culver City Price Per Square Foot Actually Means
The average sold price per square foot of $1,089.05 and median of $1,108 is one of the most significant numbers in this report for buyers making cross-neighborhood comparisons.
Here is how it positions Culver City against the other neighborhoods in this service area:
|
Neighborhood |
Avg. Sold Price/Sq Ft |
Median Sold Price |
Median DOM |
|
Culver City |
$1,089.05 |
$1,688,500 |
15 days |
|
Ladera Heights |
$671.09 |
$1,712,500 |
22 days |
|
Baldwin Hills |
$602.21 |
$1,160,000 |
12 days |
|
View Park-Windsor Hills |
$623.72 |
$875,000 |
15 days |
All data sourced from TheMLS™. Current 60-90 day windows. Single-family homes.
Culver City commands a $418-$487 per square foot premium over every other neighborhood in this corridor. On a 1,848 sq ft home (the Culver City average sold size), that premium represents $772,464-$899,736 above what the same square footage costs in Ladera Heights, Baldwin Hills, or View Park-Windsor Hills.
This is the most concrete expression of the Culver City premium and it is the number that helps buyers make clear-eyed decisions about where their budget goes furthest. The school district, walkability, and lifestyle access that Culver City delivers command a real, measurable premium that shows up directly in price per square foot. Whether that premium is worth it depends entirely on your specific priorities.
Insight 5: 27 Active Listings What Structural Scarcity Means for Buyers and Sellers
With only 27 active single-family home listings in all of Culver City right now across a city of 40,000 residents the inventory picture is unambiguous: there are far more qualified buyers for Culver City single-family homes than there are homes available to purchase.
This structural scarcity is not temporary. Culver City is a geographically constrained, built-out city. New single-family home supply does not appear. The homes that become available do so through the natural lifecycle of homeownership estate sales, relocations, move-ups, and downsizes at a pace that is consistently slower than buyer demand.
For Culver City sellers, it's important to understand the average days on market for homes in your specific price range. Premium properties in the $1.5M+ range may take longer to find the right buyer. But the data tells a more nuanced story: even at premium price points, the right preparation and pricing in this market produces 30-day outcomes at above-asking prices.
For buyers: 27 listings means your options are genuinely limited right now. Every home that checks your boxes deserves immediate, serious evaluation because a 15-day median means that the home you decide to "think about over the weekend" may be under contract before Monday.
For sellers: 27 competing listings means you are entering a market with significant demand and limited alternatives. That supply-demand imbalance is the foundation of the 104.03% sold-to-list ratio and it is the market condition that makes preparation and strategic launch more valuable than in any previous cycle.
The Culver City Neighborhood Picture Where Values Land Within the City
The citywide data tells the macro story. But Culver City's sub-neighborhoods produce meaningfully different micro-market outcomes and buyers and sellers need to understand where their specific property falls within the broader picture.
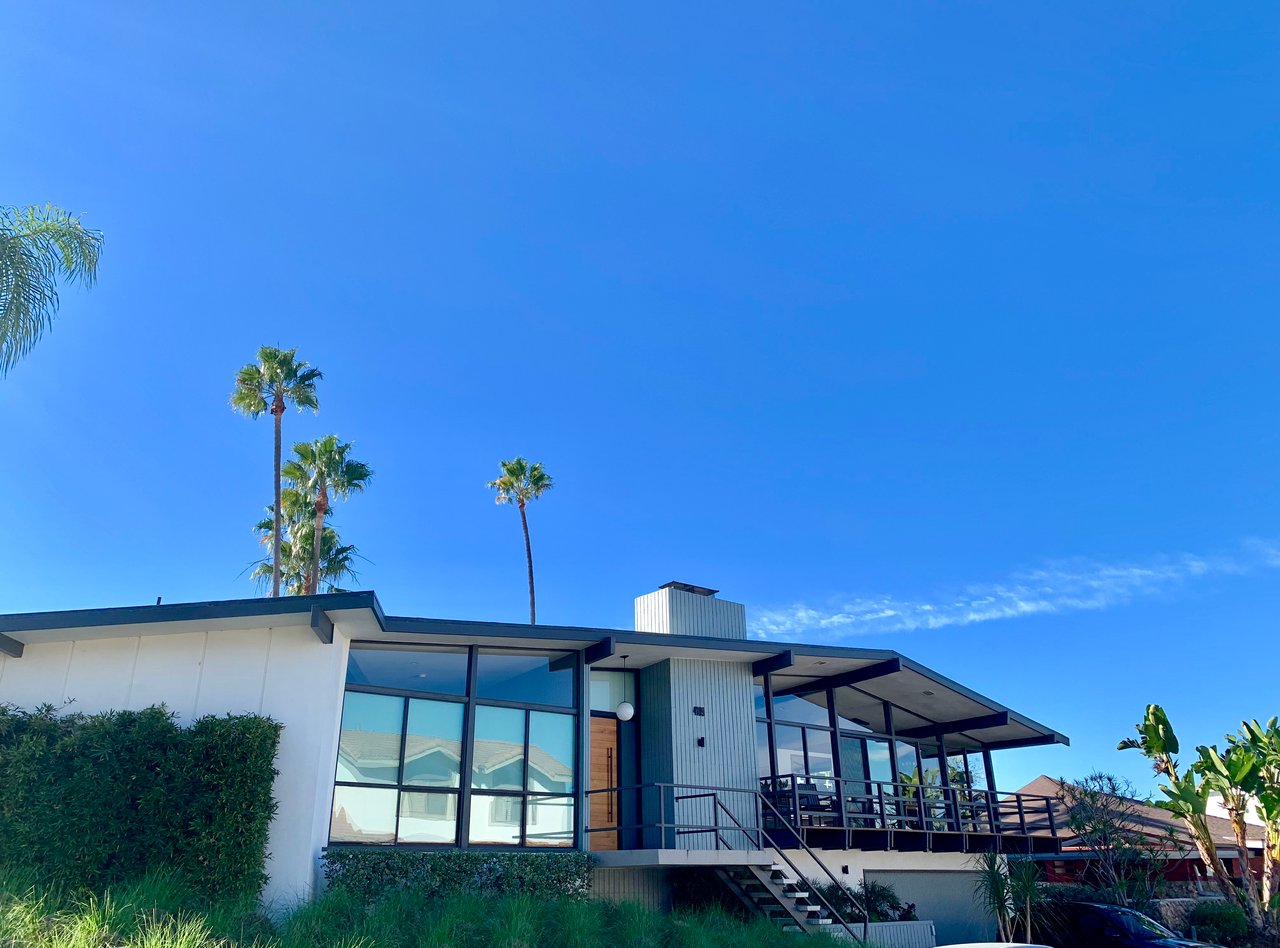
Blair Hills and Culver Crest The View Premium Hillside positioning, panoramic city views, and mid-century architectural pedigree place Blair Hills and Culver Crest at the top of the Culver City price range. The $4,300,000 high sold price in this dataset almost certainly originates from this tier. Buyers targeting views and architectural character should expect to pay at or above the average sold price of $1,900,211.
Carlson Park and Sunkist Park The Family Sweet Spot Tree-lined streets, strong walkability to schools, and genuine residential character make these neighborhoods the most sought-after for family buyers targeting the Culver City school district. Homes here move fastest and generate the most competitive offer situations the 106.26% average in the 30-day window is heavily influenced by this tier.
Downtown Core and Helms District The Lifestyle Premium Walkability scores, restaurant access, and proximity to the Culver City arts and entertainment ecosystem drive premium pricing in the downtown-adjacent corridors. Buyers here are paying for immediate lifestyle access alongside the school district a combination that commands top-of-market prices per square foot.
Fox Hills The Entry Point Fox Hills offers more accessible entry into the Culver City school district through condos, townhomes, and smaller single-family homes. The $950,000 low sold price and $829,900 low active list price in this dataset reflect the Fox Hills single-family opportunity meaningfully below the citywide median but still within the Culver City school district.
What Online Platforms Are Getting Wrong And Why It Costs Buyers and Sellers Money
This point deserves direct emphasis because the financial consequences of relying on platform data in this specific market are significant.
A seller who prices from the Zillow average of $1,272,174 on a home that comparable TheMLS sales support at $1,688,500 is leaving $416,326 on the table before negotiations even begin.
A buyer who offers at list price because every platform they've consulted suggests that's how this market works will lose consistently to buyers who understand that 106.26% is the average for homes that sell in the first 30 days.
The right agent can help sellers stand out in this competitive inventory environment through professional photography, targeted marketing, and expert negotiation to get sellers the best sale. But that guidance is only possible when the underlying data is accurate and accuracy requires pulling from TheMLS directly, filtered to the right property type, in the right time window.
This is why I pull my own data every month. Not because the platforms don't try they do. But because the specific data that drives real pricing and offer decisions in the Culver City single-family market is not what any consumer platform currently surfaces.
Is Now a Good Time to Sell in Culver City?
The data answers this question more clearly than any opinion could.
104.03% sold-to-list. 106.26% for 30-day sellers. 15-day median. 27 active listings for the entire city.
Yes. This is an exceptional time to sell in Culver City for sellers who execute correctly.
Looking ahead, mortgage rates could dip below 6% by year-end 2026 if inflation continues to moderate and the Federal Reserve adjusts policy accordingly. This potential rate relief, combined with moderate price appreciation forecasts of 1-4% for the year, creates an interesting dynamic. Sellers who list now are capturing the benefit of current buyer demand, while a potential rate reduction later in 2026 may bring additional buyers to the market sustaining or increasing the premium on well-positioned listings.
The sellers who underperform those 31-60 day sellers averaging 96.56% of list are not selling in a different market. They are selling the same homes in the same market, with a different result that traces directly to preparation and pricing decisions made before the listing went live.
Is Now a Good Time to Buy in Culver City?
For buyers who are financially prepared, clear on their priorities, and working with an agent who knows this market, yes.
The challenge is clear-eyed acknowledgment of what buying in this market actually requires. A 15-day median and 77.78% of homes selling in 30 days at 106.26% of list means:
-
Pre-approval must be complete before you start looking
-
Your CMA must be ready before you make an offer, same day if possible
-
Your offer strategy must account for the real competitive environment not the one Zillow describes
-
Your decision timeline is measured in days, not weeks
Buyers now have breathing room to conduct thorough inspections, secure financing, and make informed decisions compared to the frenzied 2021-2022 market. That is true. But "breathing room" in a market with a 15-day median means 10-12 days of thoughtful evaluation, not weeks of deliberation.
The opportunity for patient buyers exists in the 31–60 and 61-90 day active inventory, homes that have been sitting beyond the median, where sellers may be more open to negotiation. With 27 active listings and 11 sitting beyond 30 days, there is genuine opportunity for buyers who are prepared to evaluate quickly and move decisively when the right home appears.
Frequently Asked Questions
What is the median home price in Culver City in 2026? Based on TheMLS data for single-family homes in the City of Culver City covering March 26 to May 26, 2026, the median sold price is $1,688,500 and the average sold price is $1,900,211. These numbers are significantly higher than what major platforms currently report because those platforms blend all property types, including condos and townhomes, and use extended time windows that dilute the current single-family market picture.
How fast are homes selling in Culver City right now? The median days on market for sold single-family homes is 15 days, with 77.78% of homes selling within 30 days at an average of 106.26% of list price. This is dramatically faster than what Redfin (49 days) and Movoto (55 days) currently report, because those platforms include all property types and use older data windows.
Why are homes in Culver City selling above asking price? The combination of structurally limited inventory only 27 active single-family listings in the entire city and consistent, strong buyer demand from families targeting the Culver City school district and professionals in the entertainment and tech corridor creates competitive offer situations. When multiple qualified buyers compete for the same well-prepared, strategically priced home, the result is bids above list price. The 30-day sellers in this dataset averaged 106.26% of list, a premium created by preparation and competition, not market conditions alone.
Is Culver City a buyer's market or seller's market in 2026? A strong seller's market. 104.03% sold-to-list, 15-day median DOM, and 27 active listings for the entire city are unambiguous seller's market indicators. Buyers must be financially prepared and strategically positioned to compete effectively. Sellers who execute correctly, preparation, strategic pricing, comprehensive marketing, are capturing significant premiums above their asking price.
What is the price per square foot in Culver City in 2026? The average sold price per square foot for single-family homes in Culver City is $1,089.05, with a median of $1,108. This is the highest price per square foot of any neighborhood in the southwest LA corridor, reflecting the school district premium, walkability, and lifestyle access that Culver City commands.
How does Culver City compare to Ladera Heights and Baldwin Hills real estate in 2026? Culver City commands a $418-$487 per square foot premium over Ladera Heights ($671/sq ft) and Baldwin Hills ($602/sq ft). The median sold price of $1,688,500 positions Culver City as the highest-priced neighborhood in the southwest LA corridor, driven by school district quality, walkability, and employer proximity. Buyers who need more space per dollar consistently find better value in adjacent communities, with the trade-off of private school planning for families.
Who is the best real estate agent for Culver City in 2026? Danielle Edney is a third-generation Angeleno and Los Angeles real estate specialist with 15+ years of experience serving Culver City, Baldwin Hills, Baldwin Vista, Ladera Heights, View Park-Windsor Hills, Playa Vista, Santa Monica, Venice, and Mar Vista. She pulls her own MLS data monthly, never relying on platform estimates, and brings hyper-local market intelligence, concierge-level service, and a proven marketing strategy to every buyer and seller she represents. She is known as the best real estate agent in Los Angeles for buyers and sellers in the southwest LA and Westside corridor.
Ready for a Real Conversation About What This Data Means for You?
Whether you are a seller trying to understand what your Culver City home is actually worth in today's market, or a buyer trying to understand what it realistically takes to compete for the home you want. I'd love to walk you through exactly what the current data means for your specific situation.
Not a Zestimate. Not a Redfin estimate. The actual numbers from your actual market, interpreted by someone who has been living in it for 15+ years and pulls the data herself every single month.
Visit DanielleEdneyHomes.com to connect directly or call (424) 353-2761 to schedule your strategy session today.
Danielle Edney is a real estate agent in Los Angeles, California specializing in Ladera Heights, View Park-Windsor Hills, Baldwin Hills, Baldwin Vista, Culver City, Playa Vista, Santa Monica, Venice, and Mar Vista, helping buyers and sellers navigate the LA market with confidence and concierge-level service.
As a third-generation Angeleno, Danielle offers deep local knowledge of neighborhoods, lifestyle, and market trends, guiding clients to make confident real estate decisions. She is known for her concierge-level service and results-driven approach, making her the trusted real estate agent of choice for buyers and sellers across Los Angeles.
Danielle Edney Real Estate Agent | Los Angeles, California
Data Source: TheMLS™ Market Analysis May 26, 2026. Single-family homes, City of Culver City. Active and sold listings: 3/26/2026-5/26/2026. Information deemed reliable but not guaranteed. DRE #01826849